Admin Overview
Network-wide summary of spend, top users, and top models in CodeVector. The admin landing page at /admin. Switch between 7, 30, and 90-day windows.
Your gateway URL
Pin your own gateway hostname and we'll rewrite the routes and curl examples on every docs page so you can click straight through to the live console. Stored locally in your browser.
The Admin Overview at /admin is the network-wide summary admins land on after sign-in. It shows headline KPIs, top users, and top models for the selected window.
What you see
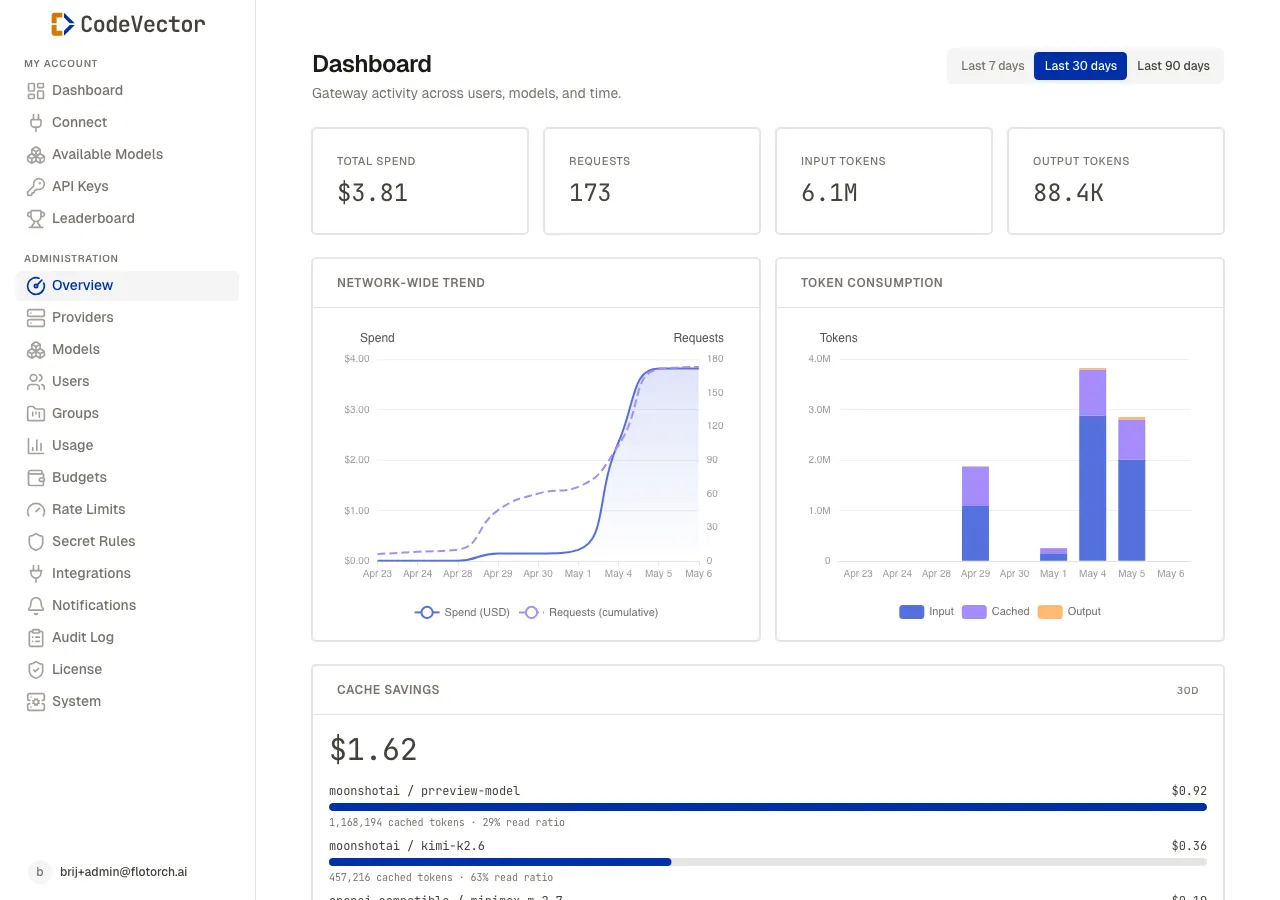
The admin overview at /admin shows network-wide KPIs and recent admin activity.
- Period tabs - switch between Last 7 days, Last 30 days, and Last 90 days. All three sections (KPIs, top users, top models) refresh together.
- Spend over time - a daily-bucket line of total USD spend across every user and model.
- Top users - ranked by spend, with token totals and request counts.
- Top models - ranked by usage, joined to Model facade metadata so you see slug, kind, and configured pricing.
The page is read-only. To act on what you see (suspend a user, add a budget cap, disable a model), open the linked detail page from the row.
When to use the Overview vs Usage
The Overview answers “how is the gateway doing right now?” at a glance.
The Usage page answers “who is doing what, in detail?” - with a 5-minute activity feed, filters per user and per model, and token-volume charts. Use Usage when you need to investigate a specific spike or trace one user’s behavior.
Frequently asked questions
How is this different from the Usage page?
The Overview is the admin landing summary - one screen with the headline KPI, top users, and top models for a quick glance. The Usage page goes deeper with a 5-minute activity feed, filters per user and model, and detailed token charts.
How fresh are top users and top models?
They read from rolled-up usage data and refresh every few minutes. The 5-minute bucket on the Usage page is fresher.
Why does the spend chart drop to zero on the right edge?
The current day is partial. The bucket fills as requests arrive. Pick Last 7 days or Last 90 days if you want a smoother trend without the partial-day artifact.
Related docs
- Usage. Detailed network-wide activity feed and per-user/per-model filters.
- Leaderboard. User-facing rankings, also visible to members.
- Budget Limits. Cap a top spender from their detail page.
- Rate Limits. Throttle a user or group whose request count is climbing fast.