Usage
Monitor network-wide usage in CodeVector. View spend, requests, input tokens, and output tokens across every user and model.
Your gateway URL
Pin your own gateway hostname and we'll rewrite the routes and curl examples on every docs page so you can click straight through to the live console. Stored locally in your browser.
The Usage page shows network-wide gateway activity. Four KPI cards display spend, requests, input tokens, and output tokens for the selected period. Two charts track activity trends and token consumption over time.
Usage overview
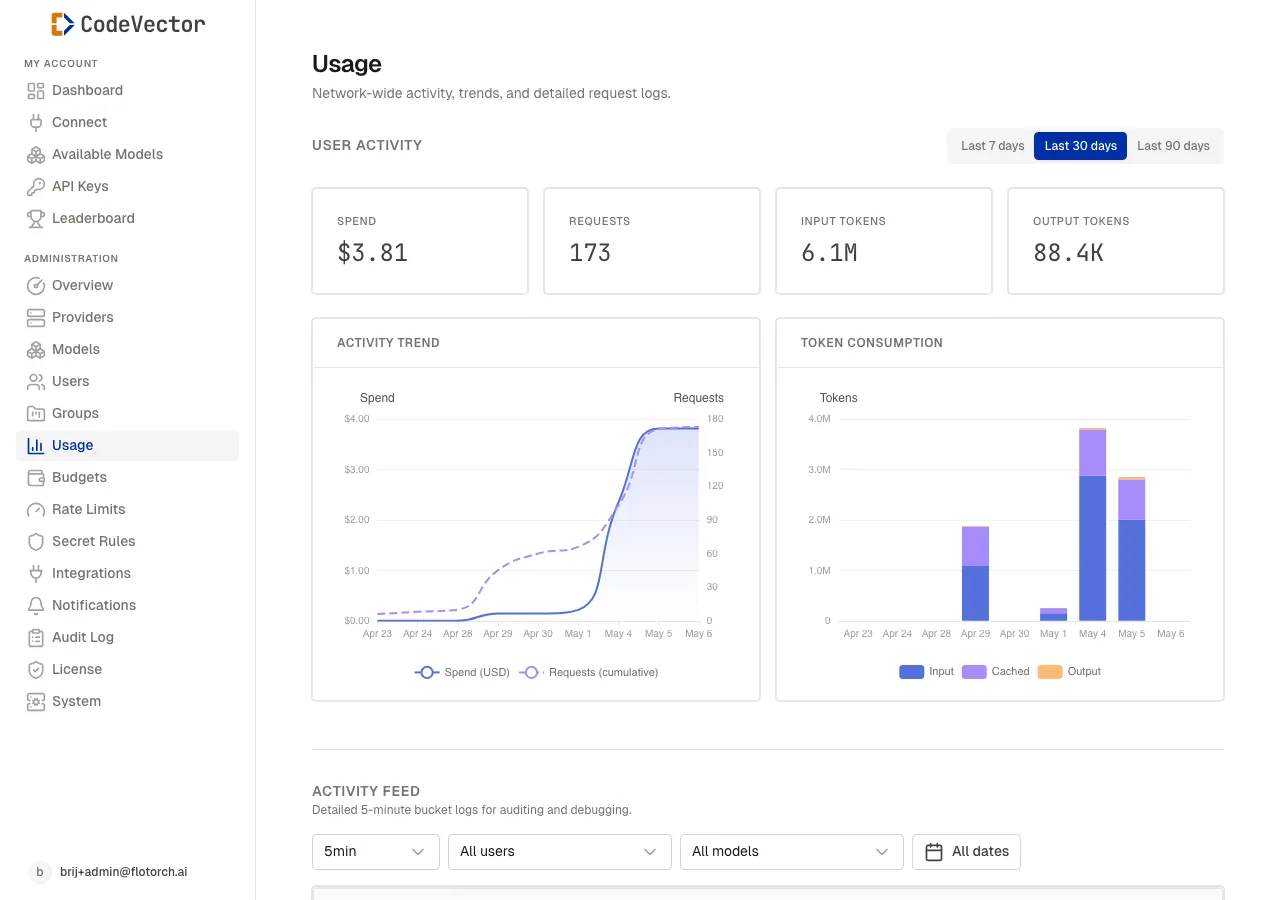
The Usage page shows network-wide KPIs and trends for the selected time window.
Open /admin/usage to see the dashboard. Use the period tabs to switch between:
- Last 7 days
- Last 30 days
- Last 90 days
The KPI cards show:
- Spend - total estimated cost in USD.
- Requests - total API calls.
- Input tokens - tokens sent to models.
- Output tokens - tokens received from models.
Below the cards, two charts show:
- Activity Trend - spend over time by day.
- Token Consumption - input and output token trends.
Data freshness
Every gateway request increments counters in the current 5-minute bucket via atomic UPSERT. Hour, day, and month rollups happen on a schedule. The 5-minute view is always the freshest.
Degraded mode
If the database becomes unavailable, usage deltas are serialized to disk at /var/lib/codevector/usage-buffer/. A background worker drains the buffer and replays the same UPSERT when connectivity returns.
Frequently asked questions
How fresh is the usage data?
The 5-minute bucket is updated on every gateway request. Hour, day, and month rollups happen on a schedule.
Can I see usage per user?
Yes. Open a user detail page to see their personal usage dashboard with the same KPI cards and charts.
What happens if the database is unavailable?
Usage deltas are buffered to disk and replayed when the database recovers. No data is lost.
Related docs
- Leaderboard. Rankings of top users by tokens, spend, or requests.
- Budgets. Set spend caps that block requests when exceeded.
- Models. The model facades that generate usage data.