Dashboard
Your personal CodeVector dashboard. Track spend, requests, and recent activity for the API keys attributed to you across 7, 30, and 90-day windows.
Your gateway URL
Pin your own gateway hostname and we'll rewrite the routes and curl examples on every docs page so you can click straight through to the live console. Stored locally in your browser.
The Dashboard at / is your personal home in CodeVector. It shows the same KPI cards and charts as the admin Usage page, but scoped to your own gateway requests.
What you see
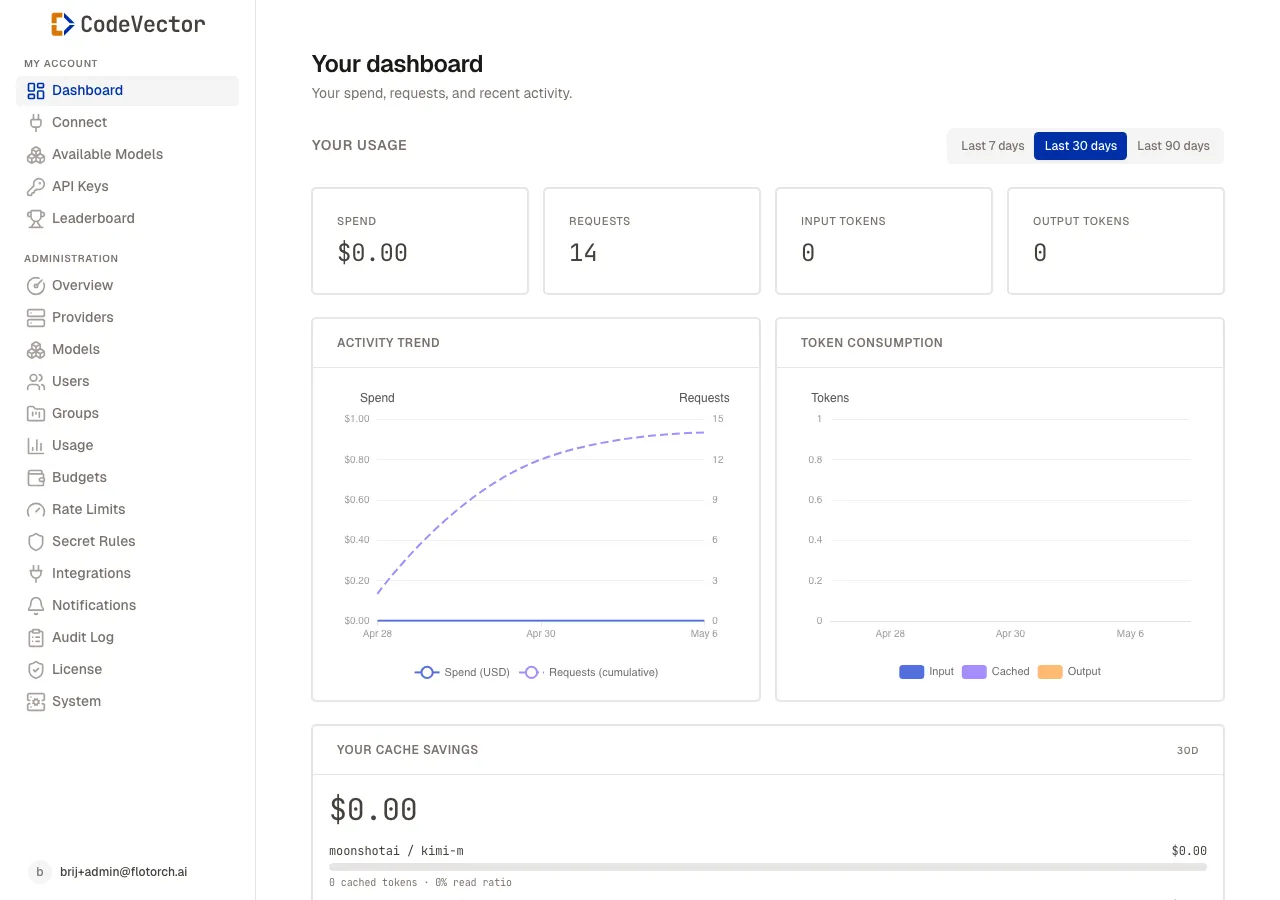
Your dashboard at / shows your own gateway activity for the selected window.
The KPI cards and charts on this page reflect your own activity:
- Spend - estimated cost in USD for the selected window.
- Requests - total gateway calls.
- Input tokens and Output tokens - counted from each request’s usage block (or estimated when the upstream did not return one).
- Activity Trend - spend and request count over time.
- Token Consumption - input, cached, and output token volumes.
Use the period tabs to switch between Last 7 days, Last 30 days, and Last 90 days. The charts redraw immediately - no additional clicks.
How attribution works
Every gateway request is tagged with the user, the API key, and any x-client-app or x-project header you sent. The dashboard rolls those up by user, so the numbers here are exactly what you’ve consumed regardless of which IDE or repo issued the call. Set per-project attribution by running codevector init in your repo or by sending the x-project header from your own SDK code.
Frequently asked questions
Whose data does this page show?
Only your own. The dashboard is scoped to the API keys attributed to your user. Admins see the same view here for their personal keys, plus a separate network-wide overview at /admin.
How fresh is the data?
The current 5-minute bucket is updated on every gateway request, so spend and request counts are near-real-time. Older buckets roll up to hourly, daily, and monthly on a schedule.
Why does my spend look low?
Spend is estimated from the request’s reported usage block (input tokens, output tokens, cached tokens) multiplied by the configured per-million pricing on the Model facade. If a request returned no usage block, the heuristic tokenizer fills in instead.
Related docs
- Available Models. The model slugs your API key can reach.
- API Keys. The bearer tokens that drive your dashboard numbers.
- Leaderboard. Network-wide rankings by tokens, spend, or requests.
- Usage. Admin view of network-wide trends.